DATA VIZ
Great Mountains of the World
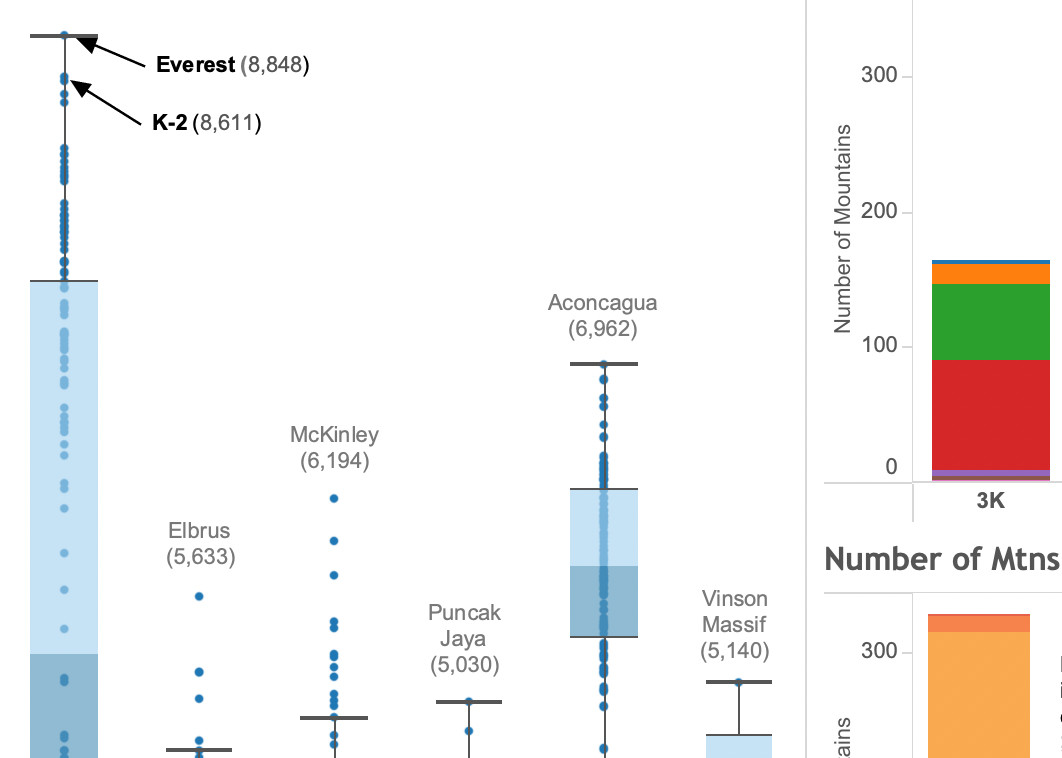
Tableau data visualization showing how great mountains of the world stack up, with added focus on Colorado 14ers.
Diverse interests related to understanding the world more clearly and making better decisions through data, with a strong preference for visualization and a focus on digital analytics for improving website effectiveness.
Examples of recent work. More to come!

Tableau data visualization showing how great mountains of the world stack up, with added focus on Colorado 14ers.

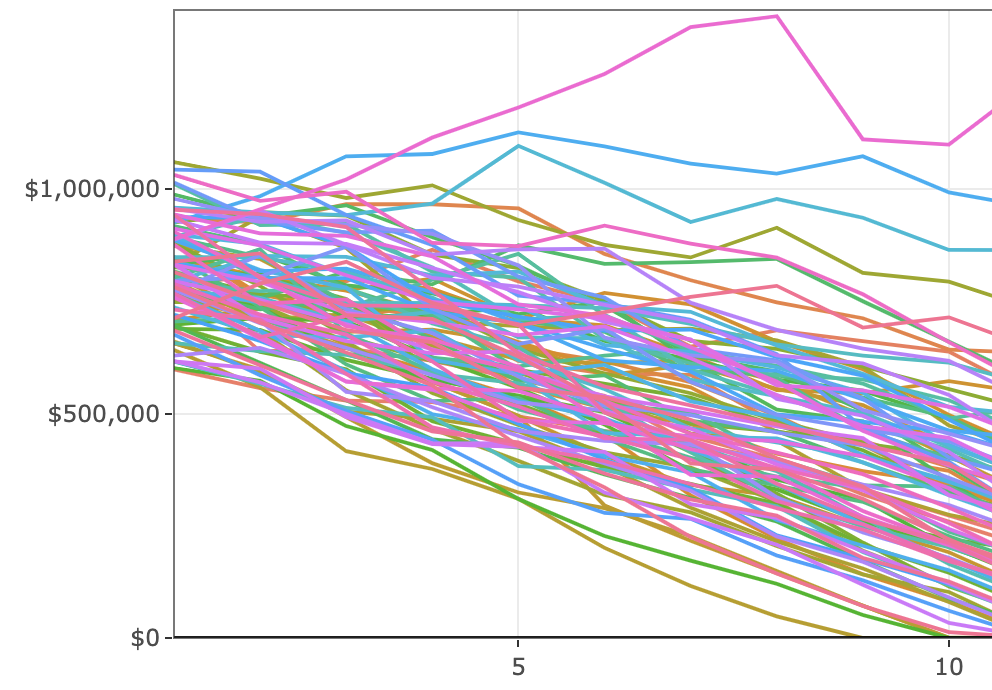
Do you have enough money to last in retirement? This interactive R Shiny web app lets you run simulations based on various scenarios, with some probability distributions working in the background. Produced in RStudio, running live on shinyapps.io.

I'm a big believer in the power of data to make the world better. To help us make sense of the world around us, and make decisions for a better future. To help us get a baseline understanding of a situation that we can share as a starting point for solving problems, removing some of the biases and subjectivity that can cloud our judgment. In some cases, for machines to make decisions for us, based on how they respond to the data they receive.
Which is not to suggest that all you need is data and the rest happens automatically. Data must be handled responisbly, explored carefully, and used to generate insights with both diligence and caution. I have been on a journey to build a practice to do just that, in one way or another, for most of my professional career.
I live in Vancouver, BC.
Contact info coming soon.